DATA ANALYTICS • BUSINESS INTELLIGENCE • SOFTWARE DEVELOPMENT
About
A little about me
Hi! I'm Annalise Harms. I'm based in Munich and have a bachelor's degree in Computer Science.
I've always been someone who enjoys learning new things and taking on new challenges. Over time, that curiosity grew into an interest in technology and data, and it's where I found the kind of work I genuinely enjoy.
I'm currently looking to further my career in data analytics or business intelligence.
Outside of work, you'll usually find me on a badminton court, getting lost in a fantasy novel, or exploring Munich. I enjoy learning new things, meeting new people, and finding the next project to dive into.
Experience
Where I have worked
Jun 2024 - Mar 2026
Office of Strategic Initiatives Intern
University of Illinois
Designed and implemented a survey system to evaluate a pilot program expanding access to virtual higher education for underprivileged students across 25 high schools
Translated comprehensive data from 1,000+ students into Power BI dashboards that revealed program-wide trends and insights, providing evidence that helped support the program's continuation
Developed a comprehensive business plan for the University of Illinois proposing a system-wide data and delivery framework to track non-credit learners and expand the university’s lifelong learning ecosystem
Conducted stakeholder interviews with 10+ university departments to support migration to a new alumni communication platform
Dec 2025 – Feb 2026
Technology Consultant
Target Technology Department
Assisted customers with selecting consumer electronics by explaining technical specifications, comparing product features, and recommending solutions based on customer needs and budgets
Maintained product organization and shelf restocking to keep electronics inventory accessible and well presented
Jun 2025 – Dec 2025
Software Engineering Intern
SPARQ AI Solutions
Designed and managed PostgreSQL databases for an automotive software platform by developing normalized data models that eliminated redundancy, improved performance, and supported evolving business requirements
Collaborated with clients to gather requirements and applied their input to guide database design decisions
Coordinated with a team of four developers in an Agile (Scrum) workflow, using Jira to manage sprints, track progress, and coordinate tasks
Projects
Selected work
Data Analytics
Student Analytics Dashboard
An interactive Power BI dashboard designed to monitor the performance of a statewide higher education pilot program across 25 Illinois schools and more than 1,000 students.
Data Analytics
Automated Survey Reporting
An automated survey system for collecting and visualizing live stakeholder feedback across 25 schools participating in a statewide higher education pilot program.
Full-Stack Development
Senior Capstone
Event Radar is a web application designed to make event discovery and planning more intuitive for attendees and organizers.
Game Development
Minesweeper
A recreation of the classic game
Game Development
Solo Game
An original family card game
Game Development
Minesweeper
A recreation of the classic Minesweeper game. Originally developed in Java using Swing, then adapted into JavaScript to create an interactive version for this website.
Instructions: Left-click to reveal a cell, right-click to flag it.
Mines left: 40
Data Analytics
Student Analytics Dashboard
The data displayed is a modified and anonymized version of the original dataset.
This Power BI dashboard was created to support a statewide pilot program aimed at expanding access to higher education for underprivileged middle and high school students in Illinois. The dashboard provided stakeholders with an intuitive way to track pilot performance based on student participation, demographics, course enrollment, and academic performance across 25 schools and 1,000+ students.
The project began with consolidating student and school records from three separate Excel data sources. I cleaned, transformed, and structured the raw datasets into a single structured Excel dataset.
Within Power BI, I designed the dashboard from the ground up, creating both the visual layout and the underlying data model. I created custom DAX measures and implemented interactive slicers, allowing users to explore the data by school, department, course, gender, race, and ethnicity. The dashboard also includes key performance metrics, enrollment summaries, and course participation statistics.
A key feature of the dashboard is the Azure Maps heat map, which visualizes the geographic distribution of participating schools and students across Illinois, allowing users to quickly identify regional trends and program coverage.
To ensure the report remained a valuable tool as new datasets were generated each semester, I designed it as a reusable template. To preserve historical data, I also developed a Power BI app that enabled stakeholders to access dashboards from previous semesters.
Data Analytics
Automated Survey Reporting
1 / 5
The data displayed is a modified and anonymized version of the original dataset.
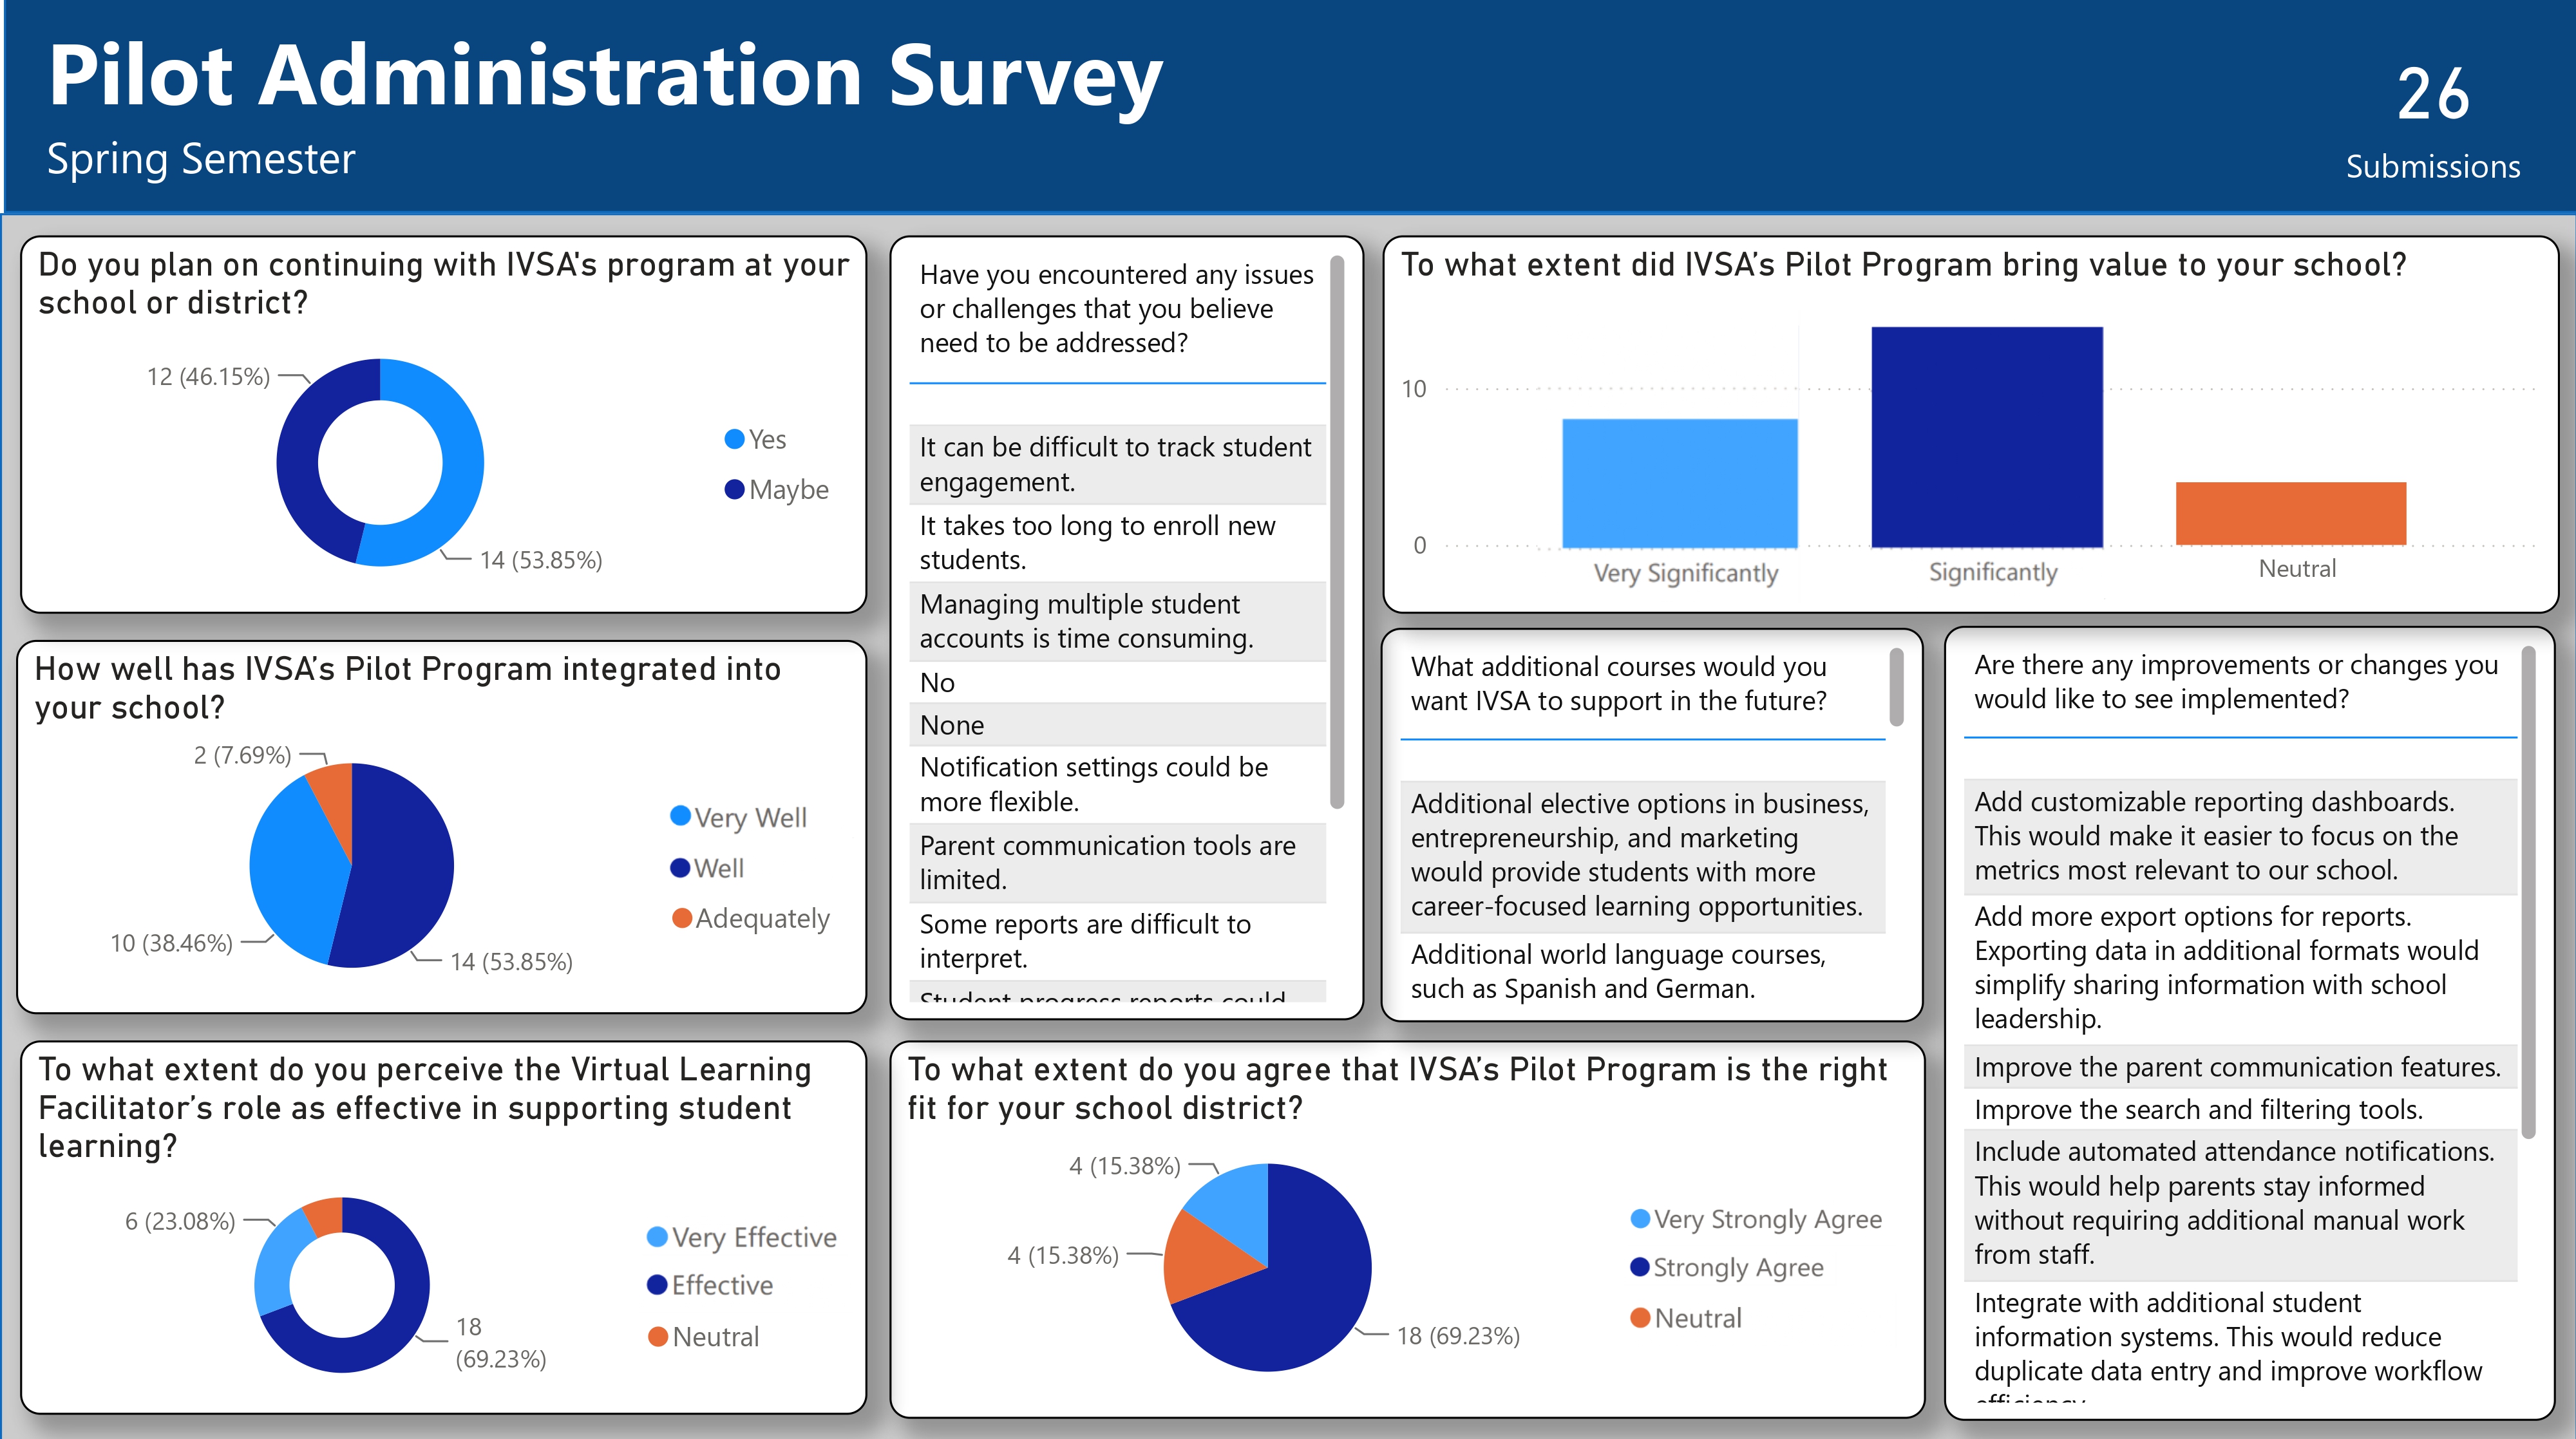
This project was developed to collect and display stakeholder feedback for a statewide higher education pilot program serving 25 schools across Illinois. The solution enabled program leadership to monitor survey responses throughout the survey period, providing visibility into participant experiences and program outcomes.
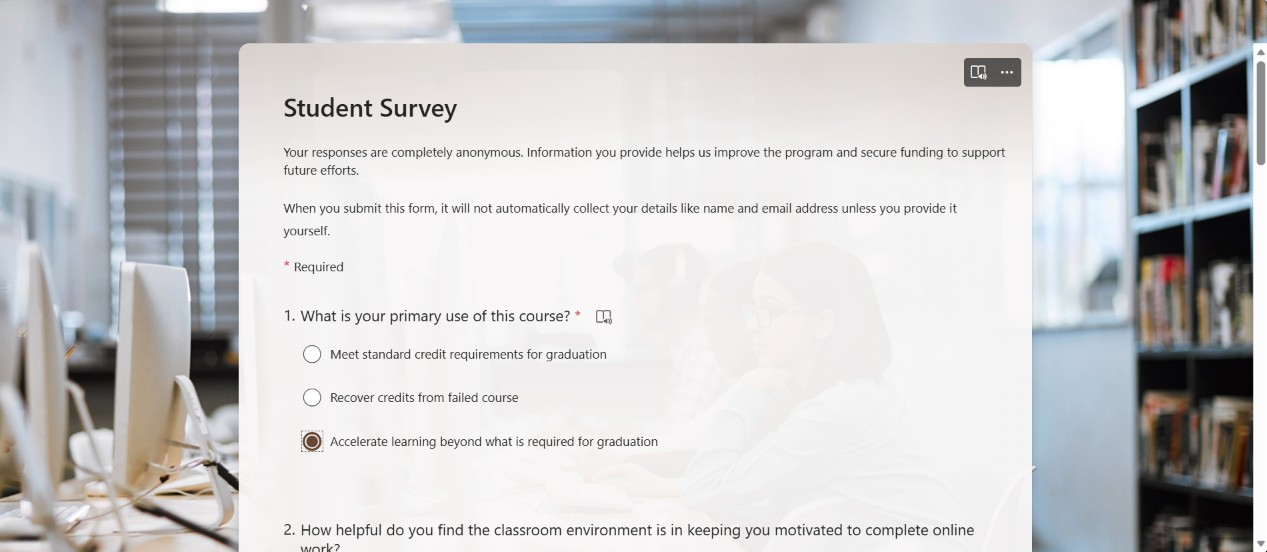
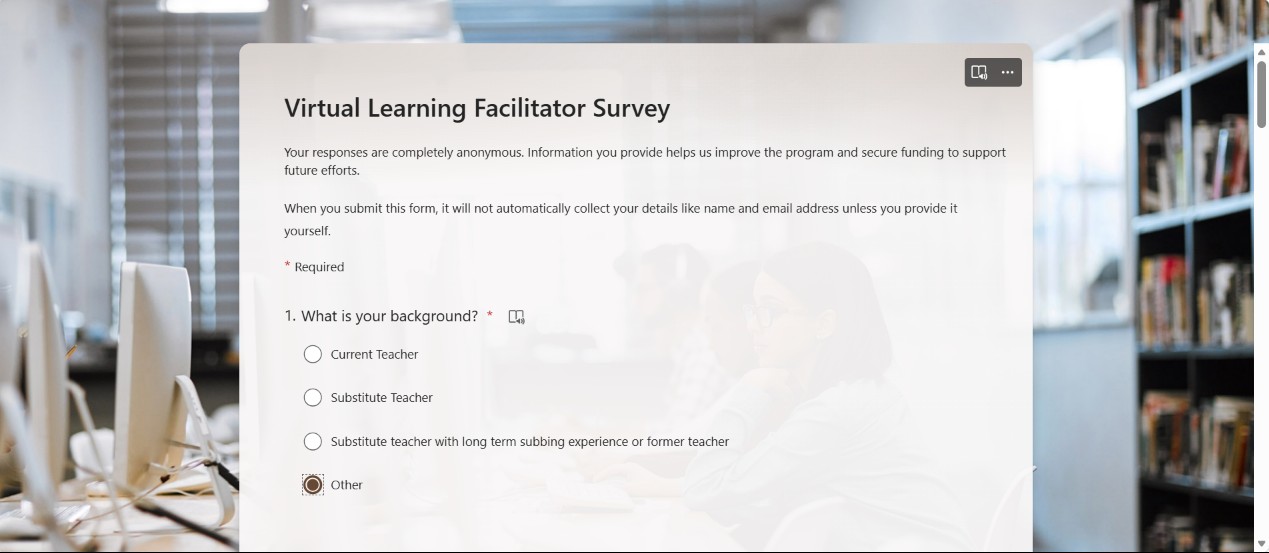
I designed four Microsoft Forms surveys tailored to each stakeholder group: students, parents, teachers (VLF), and school administrators. Each survey was customized to gather relevant feedback from each group.
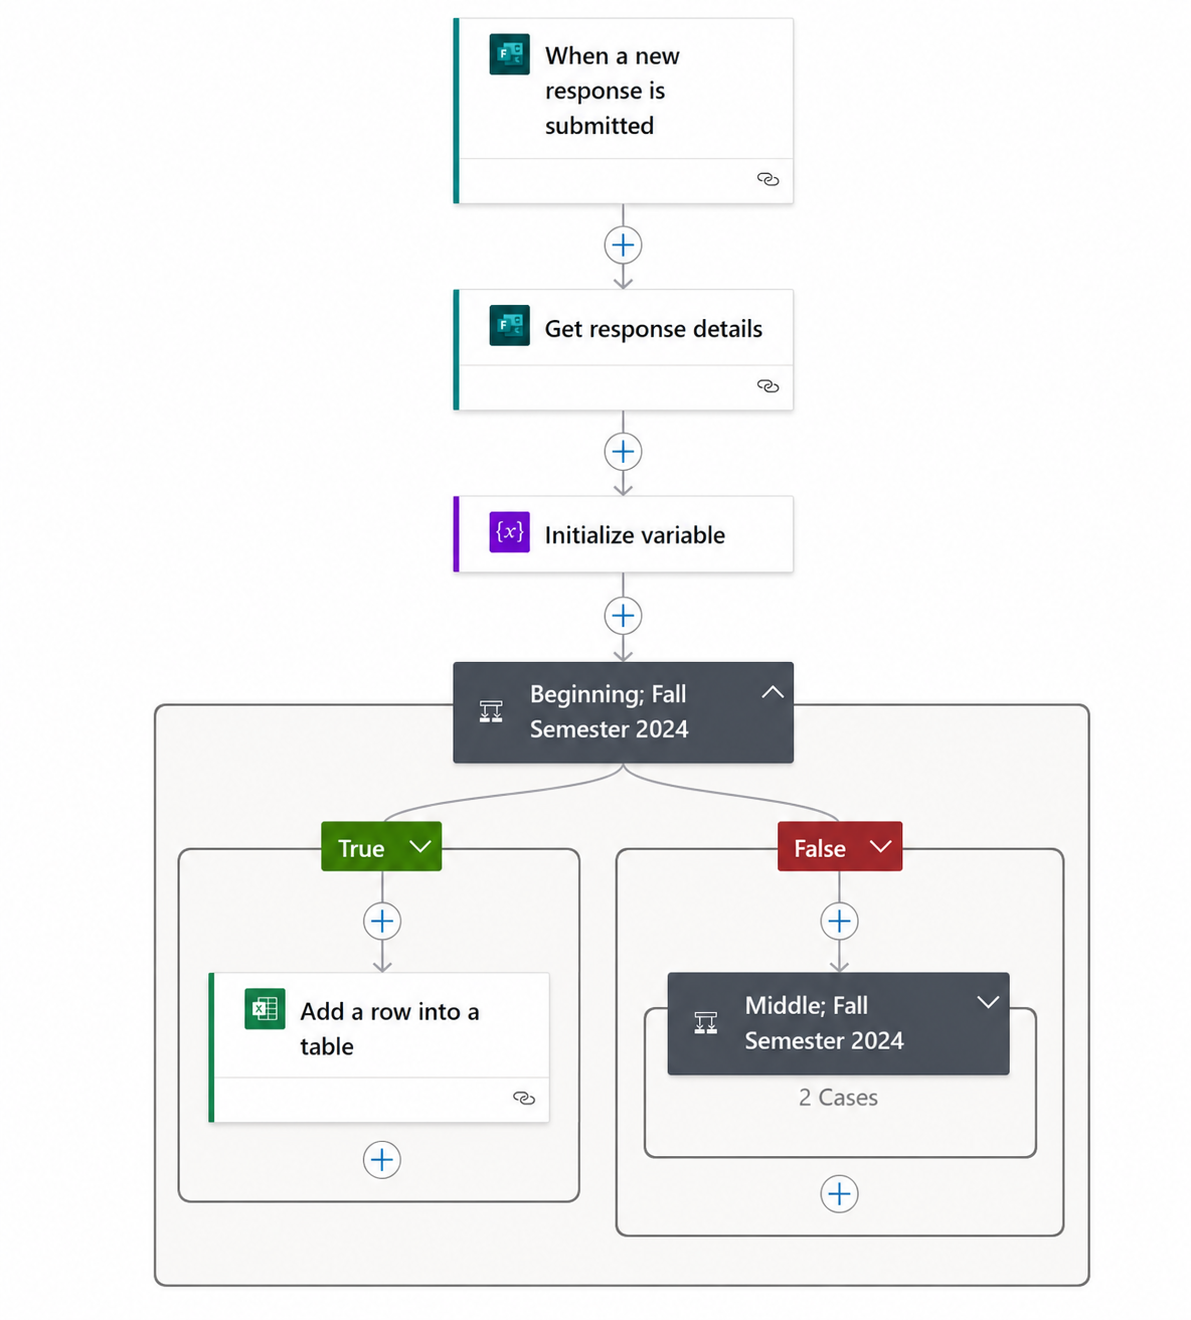
Using Power Automate, I built a workflow that automatically processed each new survey submission and transferred the data into Excel. This ensured dashboards were always populated with the latest responses.
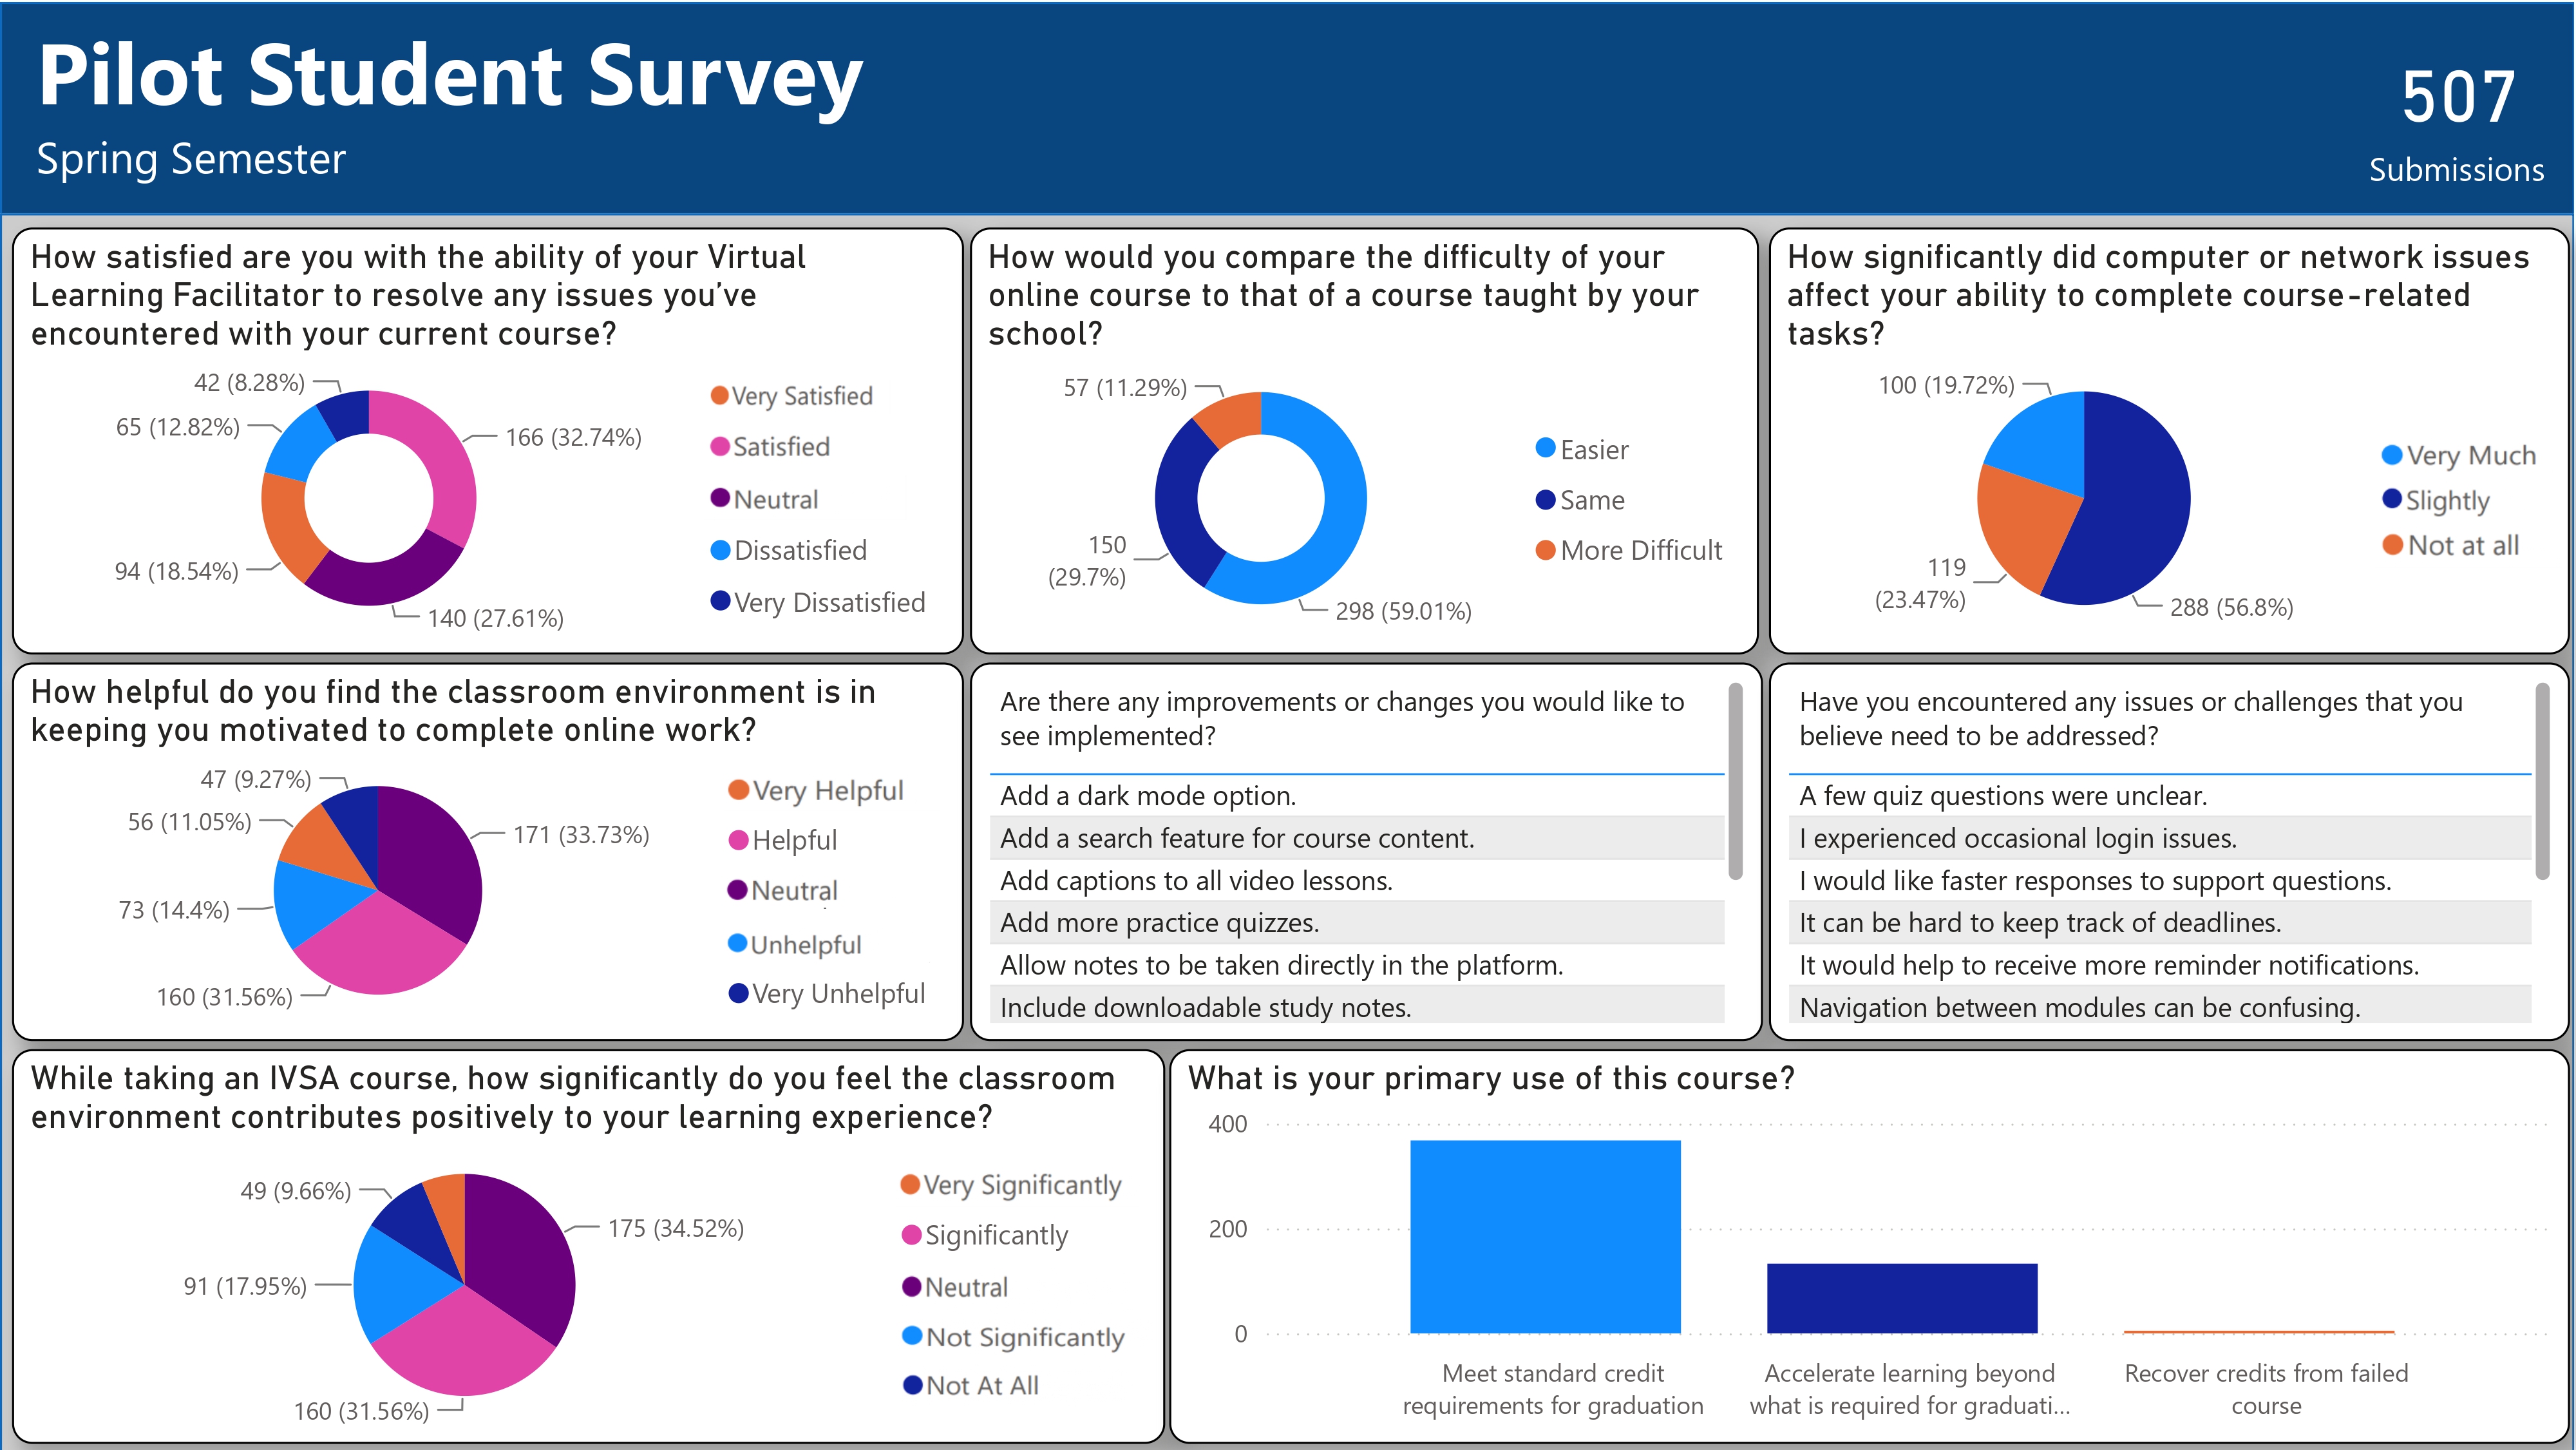
Within Power BI, I designed a suite of interactive dashboards for exploring survey results. The reports were automatically updated twice a day for the most updated data. The reports allowed stakeholders to analyze trends by stakeholder group, survey question, and reporting period.
To support future reporting cycles, the workflow and dashboards were designed to be reusable, requiring minimal maintenance as new survey responses were submitted. This ensured the reporting process could continue each semester without rebuilding the solution, providing a scalable foundation for ongoing program evaluation.
To support future reporting cycles, the workflow and dashboards were designed to be reusable. This created a scalable reporting solution that could be reused each semester without rebuilding the automation or dashboards.
*This solution was built prior to Microsoft's June 2024 release of native live Excel synchronization with Microsoft Forms, making Power Automate necessary to automate the data pipeline.
Full-Stack Development
Senior Capstone
This walkthrough uses Milwaukee, Wisconsin as an example location.
Event Radar was developed as my senior capstone project at the University of Wisconsin-Milwaukee. Working in a team of five students, we followed an Agile development process with two week sprints over the course of an academic year. The first semester focused on planning, requirements gathering, and system design, while the second semester was dedicated to building, testing, and deploying the application.
The goal of the project was to create a full stack web application that makes event discovery and planning more intuitive for both attendees and event organizers. Users can browse events on an interactive map, view three day weather forecasts, discover nearby attractions, and create personalized plans to organize their activities. Event organizers have access to a secure portal where they can register, create, and manage events.
I primarily worked on the database architecture, application hosting, and user account functionality. My responsibilities included designing and managing the MySQL database, configuring the AWS hosting environment, and developing both the frontend and backend for the login, account, and settings pages.
The application was built using Django and Python for the backend with a MySQL database hosted on AWS. Additional technologies included Folium for interactive maps, OpenStreetMap and Nominatim for geolocation services, the OpenWeatherMap API for live weather forecast and SendGrid for automated email notifications.